Markov chain · daily direction model

Add a ticker. See its up · down · flat rhythm.

Enter one or more symbols. We pull six months of daily closes, classify each day as up, down, or flat, build a transition matrix, and simulate the next ten trading days.

Tip: separate multiple tickers with commas.

What is a Markov chain?

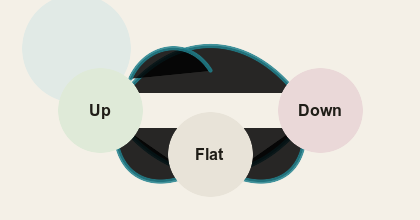
A Markov chain is a simple model of state-to-state transitions: the probability of the next state depends only on the current state, not on the full past. Here, each trading day is one of three states based on its percent change versus the prior close:

  • Up  change > +0.5%
  • Flat  change within ±0.5%
  • Down  change < −0.5%

From the historical sequence of states we count how often each state follows each other state, then normalize the rows to get a transition matrix. Starting from the latest day, we sample forward ten steps using a seeded pseudo-random draw, so results are reproducible.

Educational only. This is a statistical exercise, not investment advice.

Enter a ticker above to build its Markov chain.

Markov chain learning center

How Markov chains describe state changes

These short educational posts explain the same ideas behind the ticker tool: states, transition probabilities, transition matrices, and why simple models need careful interpretation.

Three-state Markov chain diagram showing Up, Flat, and Down states connected by arrows

Post 1

States are the building blocks

A Markov chain starts by converting a messy sequence into a small set of states. In this site, every trading day becomes up, flat, or down based on the day’s price change.

That simplification makes the model readable. Instead of asking where price will go exactly, we ask how often the market moved from one state to another in the recent past.
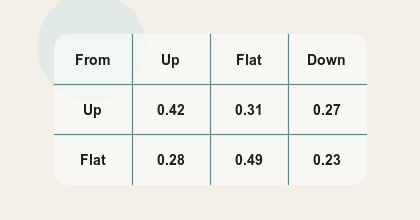
Transition matrix image showing probabilities between Up, Flat, and Down states

Post 2

A transition matrix turns history into probabilities

After each day is labeled, the model counts transitions: up-to-up, up-to-flat, up-to-down, and so on. Each row is then normalized so the probabilities add to one.

Reading across a row answers a simple question: “Given the current state, what state historically came next most often?”

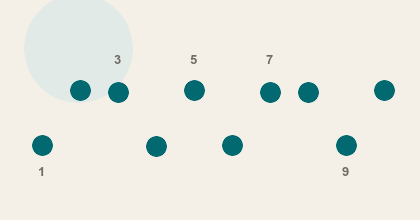
Ten-step simulated Markov chain path shown as connected points

Post 3

Simulation means sampling possible paths

The ten-step sequence is not a forecast. It is one possible path sampled from the transition probabilities. Run the model with different history windows or thresholds and the path can change.

The useful part is not any single simulated path. The useful part is seeing whether recent state transitions were balanced, persistent, or clustered around one condition.

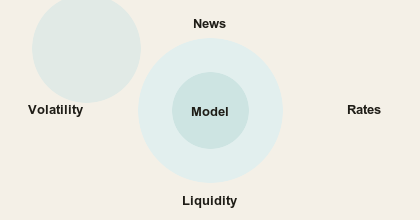
Model limitations diagram with news, volatility, liquidity, and rates around a central model

Post 4

Markets are not truly Markovian

A basic Markov chain assumes the next state only depends on the current state. Real markets are influenced by news, liquidity, interest rates, positioning, earnings, and many other variables.

That is why this site presents the output as an educational probability model, not a buy or sell signal. The model is best used for learning how transition-based thinking works.